The Oxford English Dictionary defines ‘acumen’ as meaning ‘the ability to make good judgements and take quick decisions’.
We believe that BankBI Acumen is a great way to describe the enhanced set of visualisation features we have deployed in our latest software release (Version 3.1 – March 2016).
Acumen is a series of analytical tools that enable financial results and ratios to be visually broken down, allowing systematic root cause analysis of why a performance ratio or key performance indicator has changed over time.
Answering the Why Questions
The analytical insight offered by BankBI Acumen builds on the information provided via pre-built dashboards and ratios and addresses questions immediately following a movement up or down in any performance indicator – ‘…what has caused this to happen?’.
Acumen takes the financial analyst, CFO or financial controller to the next level of detail and beyond, to the core factors that influence the management level metrics. Rather than having to open up more reports and gather disparate data elements to be calculated on yet another worksheet, Acumen enables the viewer to get to the next level of detail instantly.
By analysing a financial ratio and breaking it down via a tree structure through its various component metrics, together with embedded pivot tables BankBI Acumen allows contextual, in-line analysis of the information at whichever level the user finds themselves in BankBI’s management dashboard - corporate, regional or branch. The user can literally ‘point and click’ their way to an answer.
Upcoming BankBI Acumen Information Series
In a series of articles in the coming weeks and months, we will expand upon the BankBI Acumen theme and start using the tools to answer key financial performance questions e.g. ‘Why have my Assets increased this month?’.
Over the course of the series, we will explore how we can interrogate some key ratios. For example, in the area of Financial Performance we will drill down into key ratios such as Return on Assets, Return on Equity, Net Interest Margin and Efficiency Ratio. Whilst in the Balance Sheet we will look at the following for example Assets Growth and Loan & Deposit Growth, and finally, within the Income Statement we will look at the area of Costs and how these are changing over time.
Why have My Assets Increased by 5.61% this Month?
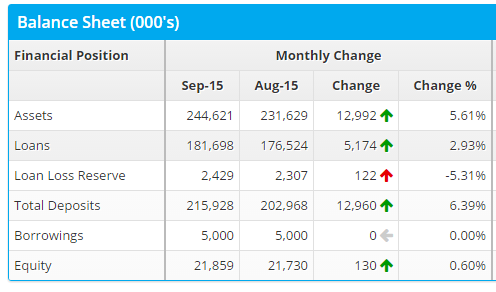
In order to begin our series, we can start by taking this question as a simple example. In the dashboard below we can see that the month on month change for Assets is an increase of $12,992k, a rise of 5.61% - however, we have no idea as to where our assets have increased – is it loans, investments, cash or of course a mix of many balances that have changed?
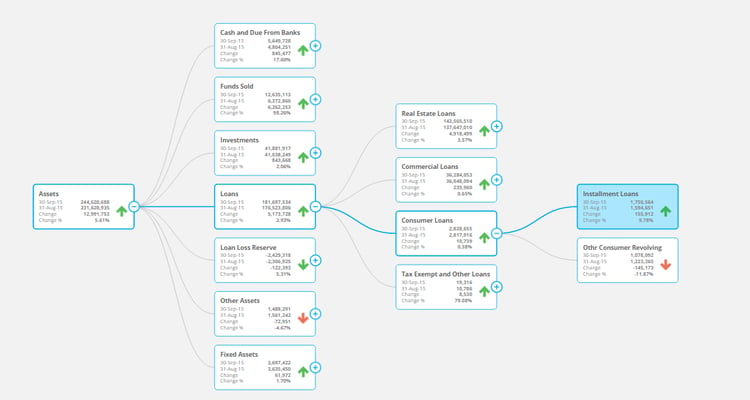
By being able to click on any value in a dashboard report BankBI Acumen provides a visualisation in the form of a KPI Tree analysis to show how the Asset balance is made up, and how each balance has changed in the month.

By being able to click and drill down on any value in a dashboard (above) BankBI Acumen provides a visualisation in the form of a KPI Tree analysis (below) to show how the Assets balance is made up and how each balance has changed in the month.

By using simple page filters, the application also lets you change the values compared in each tile. This allows the user to easily compare month on month changes, or variances to plan/budget and yearly movements (below).

Give Me Another Simple Example of How BankBI can Answer the Why Question
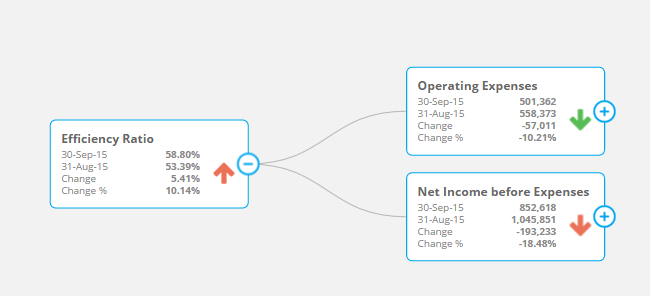
Banks often measure their Efficiency using a Cost to Income Ratio. A dashboard may show your performance is down against plan and is getting worse month over month. But Why?
- Are costs too high – if so where and in which branch?
- Are revenues too low – if so where and in which products and branches?
BankBI provides the answer to this why question by providing simple to use yet powerful analytical displays to allow users to drill deeper and deeper into the financials to understand the root cause.

Most Business Intelligence solutions can tell you What has changed but not many can easily tell you Why – Graham Goble, CEO, BankBI
I am an Existing BankBI Customer How Much Does BankBI Acumen Cost ?
There are no additional costs, it’s coming as part of our March V3.1 2016 release which is rolled out by us to all customers within your current subscription.
Do I Need Any Special Skills to Use BankBI Acumen?
BankBI is a responsive application that works in most browsers and on most devices so it is mouse or touch-driven. You need only a few basic skills to master BankBI.
What if I Want to Build My Own Views of the Data to Analyse Performance?
One of the new visualisations that we will be launching soon is a pivot table in the browser. This lets users select which fields to use in rows, columns and totals: you can then save this view for the next time you return and it will be updated with the latest information.
Want to Know More?
If you would like to see more without obligation, then please contact us for a consultation and BankBI demo meeting.


