We have been busy developing new features to improve the BankBI experience for our users.
What’s New in August?
Three New Daily Reports
- Daily Dashboard including:
- Financial Position – B/S – key indicators from the balance sheet such as Assets, Loan Portfolio, Total Deposits, Provision for Loan Loss and Equity with automatic variance calculations to compare this month to date vs. last month-end and last year-end.
- Financial Position – I/S – key indicators from the income statement such as Bad Debt Expense, Interest Income, Interest Expense with automatic variance calculations to compare the month to date vs. last month-end and the YTD figure vs. last year’s YTD figure for the same month.
- Key Ratios – Key ratios such as Loan Loss Reserve as a % of Assets, Retail loans as a % of Assets etc. with automatic variance calculations to compare this month to date vs. last month-end and last year-end.
- Daily Balance Sheet including:
- Daily Change
- Monthly Change
- Budget Variance
- Change from Last Year-End
- Daily Income Statement including:
- Daily Change
- Monthly Change
- Budget Variance
- Change from Last Year-End
Financial Performance Menu Update
The menu has been organised into more logical headings to prevent grouping too many reports in one area. The new headings are:
- Daily Reports
- Financial Results
- Balance Sheet
- Income Statement
- Yields & Margins
- Non-Performing Assets
- Capital & Risk Ratios - Basel III
- KPI Analysis
- Compare any Periods
- Branch Reporting
- Trial Balance and GL Mapping
The Financial Scorecard v Budget Dashboard has Returned
It’s back by popular demand. With automatic variance analysis against budget for Balance Sheet Indicators, Key Balance Sheet Ratios, Earnings Analysis and Key Performance Ratios.
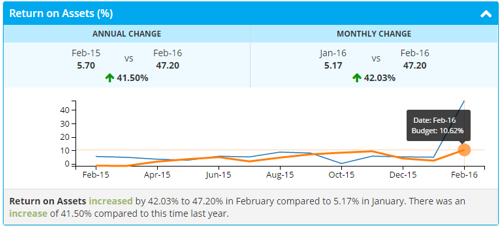
Better Bar and Line Chart Visualisations
We can now plot actual v budget on the same chart with more user-friendly analysis.
New Quarterly Analysis
We have introduced quarterly analysis using filters on certain reports such as the Balance Sheet Performance report.
New Page Export
Now every dashboard can be exported to:
- PNG image file
- PDF (image)
- Word (image)
- Excel (image)
- Data (zip file containing data in .csv files for Excel)
New Table Data Export
Data in any table on a dashboard can now be exported to Excel.
Balance Sheet and Income Statement Improvements
We have improved Balance Sheet and Income Statement readability by moving totals to the bottom of each chart of accounts level.
Looking forward to September 2016
September is planning season with:
- A new planning and budgeting application
- On-screen edit within administration
Looking forward to October 2016
Following on from planning in September; October is going to be the month of profitability with two new applications for:
- Profitability funds transfer pricing (FTP)
- Cost allocations to branches for branch profitability